
Written by William Hillis, Research Editor, RSIR
For May 2018, the S&P CoreLogic Case Shiller Index registered a 21st month with Seattle leading nationwide home prices. While competing Pacific Coast gateway cities Los Angeles and San Francisco saw year-over-year home price increases of 7.64 percent and 10.87 percent, respectively, Seattle’s 12-month advance widened to 13.59 percent. The monthly increases on the Index were 2.23 percent for Seattle, 1.08 percent for San Francisco, and 0.48 percent for Los Angeles.
The official analysis accompanying Case Shiller’s July 31 release describes the relentless and widespread continuance of residential home price gains. However, the editors signal some unease with an attendant decline in the number of home price purchases which has been escalating since last fall. David Blitzer of S&P Dow Jones Indices writes, “Continuing price increases appear to be affecting other housing statistics. Sales of existing single family homes—the market covered by the S&P CoreLogic Case-Shiller Indices—peaked last November and have declined for three months in a row. The number of pending home sales is drifting lower as is the number of existing homes for sale. Sales of new homes are also down and housing starts are flattening.”
The conditions across the country that Blitzer describes are far from prevalent in central Puget Sound. Sales are down modestly in some cities and areas of the region, but there Seattle parts ways with the nationwide trend. The supply of homes for sale spiked in May and June; and cumulative days on market, a key indicator of how quickly homes are selling, shows a median of about one week on the market in most urban areas. (See local market inventory trends in the charts below, followed by the median CDOM trends for these communities in charts “Seattle Monthly Market Times” and “Eastside Monthly Market Times.”)
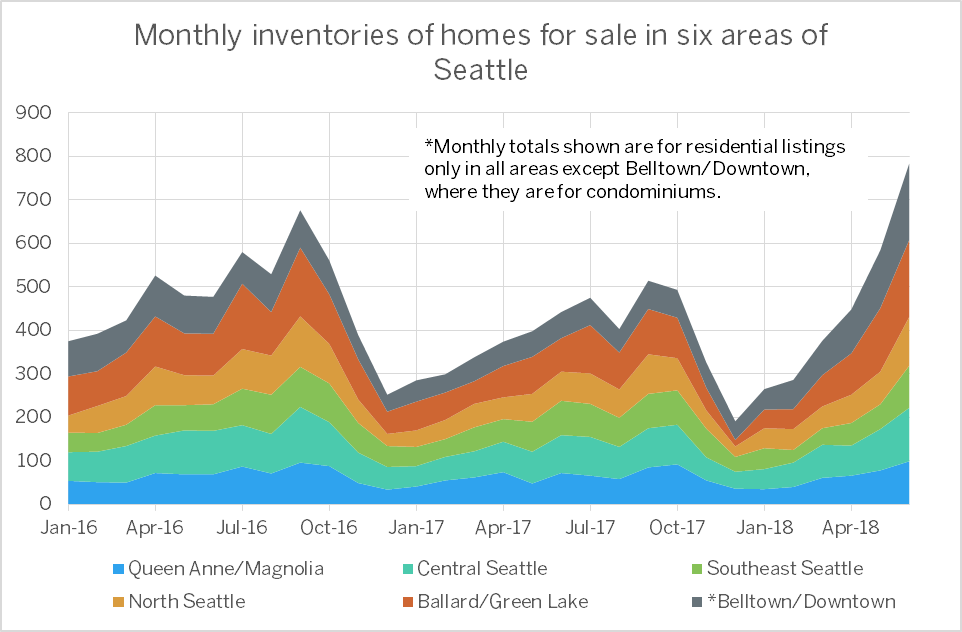


The sharp increase in home inventories most likely does not presage a market decline or a slowdown in home purchases. Listings commonly increase into the summer, and it simply appears that some of that supply has been pulled forward. This might reflect that sellers, having observed trends elsewhere, have put homes on the market to make the most of the current record-setting prices. If the years-long market times hold, these homes will appear as sold within a month or two.
For Seattle’s comparative performance on the Case-Shiller Index, see our chart of the Index trends below; and for more details, download the S&P Dow Jones Case-Shiller summary report. For details on the implications for homes in your neighborhood, contact a local RSIR broker for their latest analysis.

SOURCE: RSIR